
In the rapidly transforming realm of finance, the capacity to distill significant insights from financial statements has become paramount. As we navigate through the era of digital disruption, the escalating intricacy of business operations coupled with the relentless pace of technological advancements has rendered conventional analytical methods inadequate. In this dynamic environment, it is not just about survival but about thriving and staying ahead of the curve. Finance professionals are thus compelled to embrace innovative strategies that harness the power of state-of-the-art tools and techniques. These strategies are not merely about adopting new technologies, but about integrating these technologies to create a holistic approach to financial statement analysis.
Financial Statements
Financial statements are formal records of the financial activities and position of a business,
person, or other entity. They provide an overview of a business’s profitability and financial
condition in both short and long term like balance sheet, income statement,invoices etc..
Financial Data Analysis
Financial data analysis is the process of collecting, interpreting, and presenting financial data to assist in investment and financial decision-making. It can provide valuable insights into a company’s performance and future prospects. Here are some key aspects of financial data analysis:
1. Ratio Analysis
Ratio analysis involves comparing different figures from the balance sheet, income statement, and cash flow statement. Ratios such as the debt-to-equity ratio, return on
equity, and current ratio can provide insights into a company’s financial health.
2. Trend Analysis
Trend analysis involves looking at how a company’s financial performance has changed over time. This can help identify patterns and predict future performance.
3. Benchmarking
Benchmarking involves comparing a company’s financial figures with those of other companies in the same industry. This can provide a useful context for understanding a
company’s performance.
4. Forecasting
Forecasting involves making predictions about future revenue and expenses based on historical trends and other information. This can be crucial for budgeting and strategic planning.
5. Variance Analysis
Variance analysis involves comparing actual results with budgeted or forecasted results. This can help identify areas where performance is not meeting expectations.
6. Profitability Analysis
Profitability analysis involves assessing a company’s ability to generate profits. Profit margins, return on assets, and return on investment are some of the key metrics used in profitability analysis.
Smart Ways to Analyze Financial Statements in 2024
To analyze financial statements has transcended the realms of traditional methodologies in 2024. Today, finance professionals are embracing innovative strategies and technologies to extract deeper insights and make more informed decisions. Let’s explore some of the smart ways to analyze financial statements in this era of digital transformation.
Embrace Automation
Automation has become a game-changer in financial analysis.
Automated tools can quickly process large volumes of data, identify trends, and generate insights. They can also eliminate human errors and save considerable time and effort.
Use of AI and Machine Learning
Artificial Intelligence (AI) and Machine Learning (ML) are revolutionizing financial analysis. These technologies can analyze vast amounts of data, identify patterns, and make predictions. They can also learn from their mistakes and improve their accuracy over time. For example, a bank can use machine learning to analyze customer data and predict the likelihood of default on a loan.
Incorporate Real-Time Analysis
In 2024, the financial world moves at a breakneck pace. Real-time analysis allows you to keep up with these rapid changes. It enables you to make timely decisions based on
the most recent data.
Focus on Data Visualization
Data visualization tools can transform complex financial data into easy-to-understand
graphs and charts. These visual representations can help you grasp trends and patterns more quickly and intuitively.
Leverage Big Data
Big data refers to extremely large data sets that can be analyzed to reveal patterns, trends, and associations. By leveraging big data, you can gain deeper insights and
make more informed decisions.
Continual Learning and Adaptation
Continual learning and adaptation are crucial. As new technologies and analytical methods emerge, staying updated is key to ensuring your analysis remains relevant and insightful. By continuously learning and adapting, you can stay ahead of the curve and make more informed decisions based on the latest trends and technologies in financial analysis.
The Process to Analyze Financial Statements in 2024
Here is an overview of the key steps to analyze financial statements and the whole financial data analysis process:
1. Define the Objective:
The first step in financial data analysis is to define the objective. What are you trying to achieve with the analysis? The objective could be to assess a company’s financial
health, identify investment opportunities, or evaluate the effectiveness of financial policies.
2. Data Collection:
The second step to analyze financial statements is to collect relevant data from various sources, such as financial statements, market data, and economic indicators. With the advent of big data, finance professionals now have access to vast amounts of data that can provide valuable insights into market trends and company performance.
3. Data Cleaning and Preparation:
Once the data is collected, it needs to be cleaned and prepared for analysis. This involves removing any errors or inconsistencies in the data, and transforming it into a format that is suitable for analysis. Automated tools can be used to streamline this process and ensure the data is clean and accurate.
4. Exploratory Data Analysis (EDA):
EDA involves analyzing the data to understand its underlying patterns and relationships. This can involve visualizing the data using charts and graphs, and performing statistical tests to identify trends and anomalies.
5. Analyze Data:
This is the core step where you apply various financial analysis techniques to the data.
This could involve ratio analysis, trend analysis, variance analysis, and other methods depending on the objective.
6. Interpret Results:
After analyzing the data, the next step is to interpret the results. This involves understanding what the results mean in the context of the objective.
7. Communicate Findings :
The final step is to communicate the findings. This could involve preparing a report or presentation that clearly explains the results and their implications.
Challenges of Manual Financial Data Analysis
While manual financial data analysis has its place, it comes with a set of challenges that can hinder efficiency and accuracy. Here are some of the key challenges:
Time-Consuming
Manual financial data analysis can be incredibly time-consuming. Sorting through large volumes of data and performing complex calculations can take up a significant amount of time, which could be better spent on strategic decision-making.
Prone to Errors
Manual data analysis is susceptible to human error. Mistakes can occur at any stage of the process, from data entry to calculation, and these errors can lead to inaccurate
results.
Difficulty in Handling Large Data Sets
As businesses grow, so does the amount of financial data. Manual methods may not be equipped to handle large data sets, making the analysis process slow and cumbersome.
Lack of Real-Time Analysis
Manual analysis often involves historical data and does not allow for real-time analysis. This can be a significant drawback in today’s fast-paced business environment where timely information is crucial for decision-making.
Limited Scope
Manual analysis can be limited in scope. It might not be able to capture all the nuances and trends in the data, especially when dealing with complex financial scenarios.
The challenges of manual financial data analysis are apparent. For businesses dealing with large datasets or requiring intricate trend analysis, manual methods often fall short.
However, there is a compelling solution: automated tools. These tools not only enhance efficiency but also ensure accuracy, making them indispensable for businesses aiming to stay ahead in the data-driven economy of 2024.
Kudra: A Solution to Financial Data Analysis Challenges
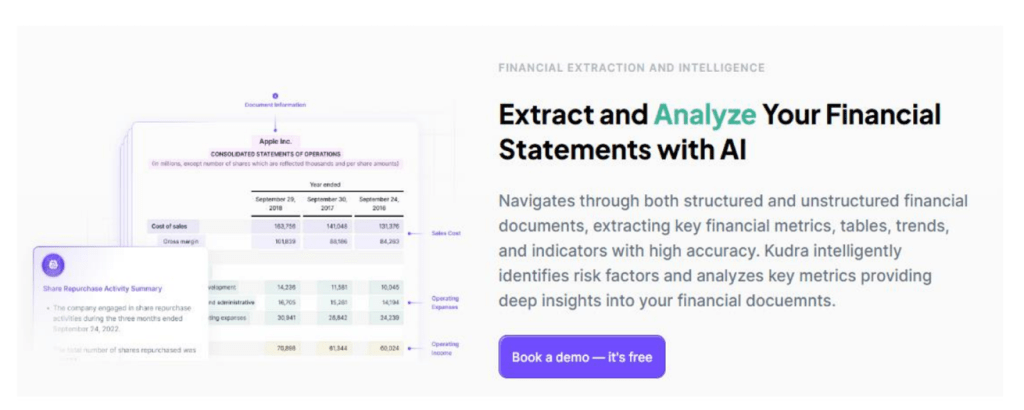
In the face of the challenges posed by manual financial data analysis, Kudra emerges as a powerful solution. Kudra is a cutting-edge platform that leverages the latest advancements in AI and machine learning to streamline your data analysis processes, allowing you to uncover insights faster and make better-informed decisions. Here’s how Kudra addresses these
challenges:
Efficiency and Speed
Kudra’s automated data extraction and categorization capabilities significantly reduce the time spent on data preparation. This allows analysts to focus more on the analysis itself, thereby increasing efficiency and speed.
Accuracy
By automating the data extraction process, Kudra minimizes the risk of human error. This ensures that the data used for analysis is accurate and reliable.
Ease of use
Kudra is designed with an intuitive interface, this simplicity reduces the learning curve for newcomers, enabling them to quickly get up to speed. In essence, Kudra’s user-friendly design democratizes data analysis, making it a tool that everyone can use to derive valuable insights from financial data. It aims to make data analysis less daunting and more approachable,
leading to better, data-driven decisions.
Personalized Intelligent Document Workflows
Kudra empowers users with the ability to construct personalized intelligent document workflows, meticulously designed to align with their unique business requirements.
This is achieved without necessitating any coding skills, making it accessible to users of all technical levels.
Scalability
Kudra is designed to handle large volumes of data, making it an ideal tool for businesses of all sizes. Its scalability ensures that as your business grows, your ability to analyze financial data grows with it.
Real-World Applications of Kudra
Bank Statements:
Uploading your bank statements to Kudra.ai is a breeze. The platform is designed to accommodate a diverse range of file formats, encompassing everything from PDFs to scanned images. This versatility ensures a smooth and hassle-free experience. The platform’s user-
friendly interface further simplifies the process, allowing you to upload multiple bank statements in one go with ease. But the real magic happens once the documents are uploaded.
Kudra.ai leaps into action, automatically processing your uploaded documents. It meticulously extracts pertinent information, transforming a pile of bank statements into structured data ready for analysis. This automation not only saves time but also enhances accuracy, eliminating the risk of human error.

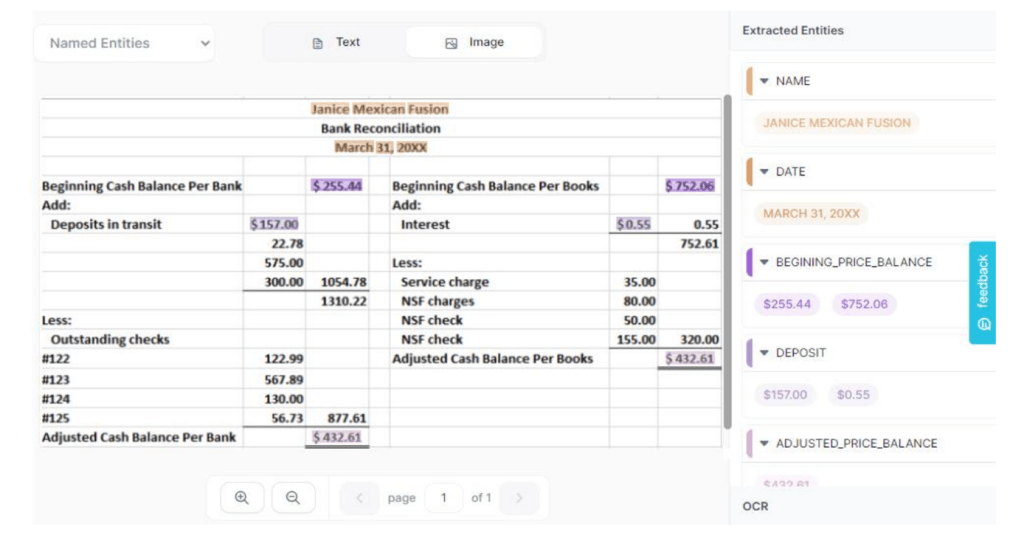
Bank Form :
You can easily upload your bank forms to Kudra.ai Once uploaded, the platform takes over,
automatically processing and extracting the required information. This automation significantly streamlines the entire document management procedure, making it more efficient
and less time-consuming.
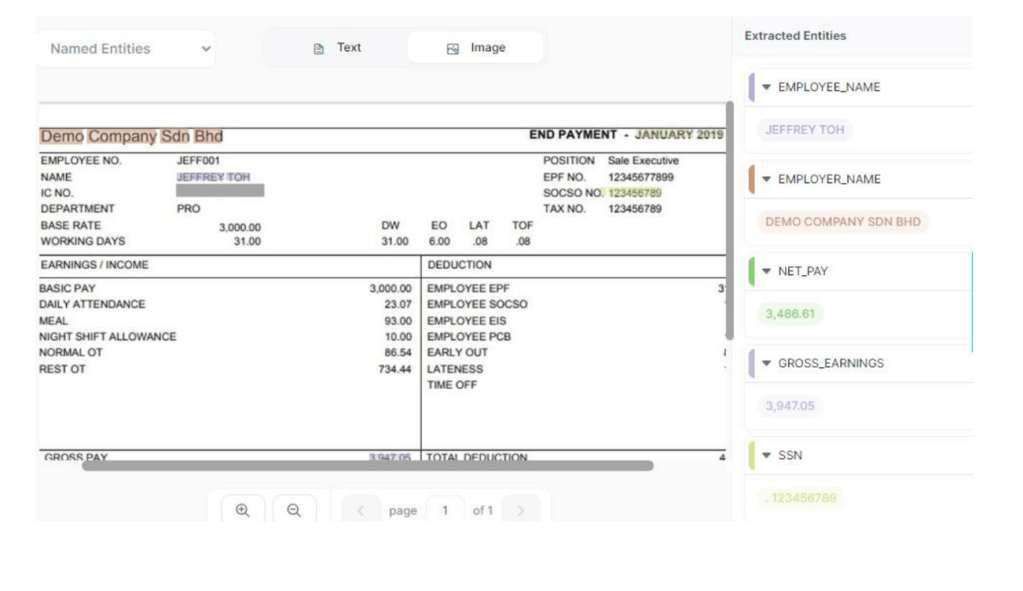
Pay slip :
Kudra stands out in its ability to extract pertinent information from pay slips using its
specialized Pay Slip Parser Template. It scrutinizes the content and structure of pay slips,
accurately extracting crucial details such as the names of employees and employers, net pay,
and other relevant data.This capability ensures that financial professionals can readily access
and employ the extracted data for various financial tasks, including payroll processing and tax
calculations. By doing so, Kudra significantly streamlines the overall workflow, making it
more efficient and less time-consuming. It’s not just about data extraction, it’s about
transforming raw data into actionable insights.
For more information about use cases of automated financial data extraction, you can read our guide: AI Financial Analysis Hacks: Skyrocket Your Growth Instantly
Conclusion
In conclusion, analyzing financial statements in 2024 requires a shift towards smarter strategies that leverage automation, big data, advanced analytics, and visualization techniques.
By adopting these approaches, finance professionals can unlock valuable insights and make informed decisions in today’s dynamic business environment; for a step-by-step guide check this : ” Building Autonomous Agent for Extracting Insights from Financial News “